COMPARING DNA SEQUENCES TO UNDERSTAND EVOLUTIONARY RELATIONSHIPS WITH BLAST
Background
Between 1990–2003, scientists working on an international research project known as
the Human Genome Project were able to identify and map the 20,000–25,000 genes
that define a human being. The project also successfully mapped the genomes of other
species, including the fruit #y, mouse, and Escherichia coli. "e location and complete
sequence of the genes in each of these species are available for anyone in the world to
access via the Internet.
Why is this information important? Being able to identify the precise location
and sequence of human genes will allow us to better understand genetic diseases. In
addition, learning about the sequence of genes in other species helps us understand
evolutionary relationships among organisms. Many of our genes are identical or similar
to those found in other species.
Suppose you identify a single gene that is responsible for a particular disease in fruit
#ies. Is that same gene found in humans? Does it cause a similar disease? It would take
you nearly 10 years to read through the entire human genome to try to locate the same
sequence of bases as that in fruit #ies. "is de!nitely isn’t practical, so a sophisticated
technological method is needed.
Bioinformatics is a !eld that combines statistics, mathematical modeling, and
computer science to analyze biological data. Using bioinformatics methods, entire
genomes can be quickly compared in order to detect genetic similarities and di$erences.
An extremely powerful bioinformatics tool is BLAST, which stands for Basic Local
Alignment Search Tool. Using BLAST, you can input a gene sequence of interest and
search entire genomic libraries for identical or similar sequences in a matter of seconds.
In this laboratory investigation, you will use BLAST to compare several genes,
and then use the information to construct a cladogram. A cladogram (also called a
phylogenetic tree) is a visualization of the evolutionary relatedness of species. Figure 1 is
a simple cladogram.
|
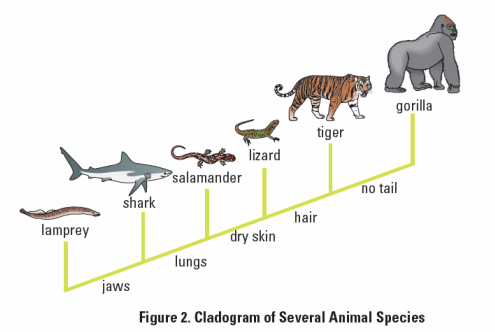
Figure 2 includes additional details, such as the evolution of particular physical structures called shared derived characters. Note that the placement of the derived characters corresponds to when (in a general, not a specific, sense) that character evolved; every species above the character label possesses that structure. For example, tigers and gorillas have hair, but lampreys, sharks, salamanders, and lizards do not have hair.
|
|
Figure 2. Cladogram of Several Animal Species
The cladogram above can be used to answer several questions. Which organisms have
lungs? What three structures do all lizards possess? According to the cladogram, which
structure — dry skin or hair — evolved first?
Historically, only physical structures were used to create cladograms; however,
modern-day cladistics relies heavily on genetic evidence as well. Chimpanzees and
humans share 95%+ of their DNA, which would place them closely together on a
cladogram. Humans and fruit flies share approximately 60% of their DNA, which would
place them farther apart on a cladogram.
7. On your worksheet, draw a cladogram that depicts the evolutionary
relationships among humans, chimpanzees, fruit flies and mosses.
8. Use the following data to construct a cladogram of the major plant groups:
Table 1. Characteristics of Major Plant Groups
|
Organisms
Mosses Pine Trees Flowering Plants Ferns Total |
Vascular Tissue
0 1 1 1 3 |
Flowers
0 0 1 0 1 |
Seeds
0 1 1 0 2 |
9. GAPDH (glyceraldehyde 3-phosphate dehydrogenase) is an enzyme that catalyzes
the sixth step in glycolysis, an important reaction that produces molecules used
in cellular respiration. The following data table shows the percentage similarity of
this gene and the protein it expresses in humans versus other species. For example,
according to the table, the GAPDH gene in chimpanzees is 99.6% identical to the
gene found in humans, while the protein is identical.
a. Why is the percentage similarity in the gene always lower than the percentage
similarity in the protein for each of the species? (Hint: Recall how a gene is
expressed to produce a protein.)
b. Draw a cladogram depicting the evolutionary relationships among all !ve species
(including humans) according to their percentage similarity in the GAPDH gene.
|
SPECIES
Chimpanzee (Pan troglodytes) Dog (Canis lupus familiaris) Fruit fly (Drosophilia melanogaster) Roundworm (Caenorhabditis elegans) |
Gene Percentage Similarity
99.6 % 91.3 % 72.4 % 68.2 % |
Protein Percentage Similarity
100 % 95.2 % 76.7 % 74.3 % |
Procedure
|
|
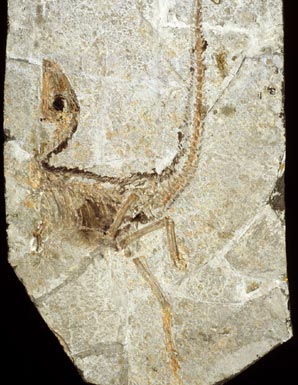
Step 1
A team of scientists has uncovered the fossil specimen above near Liaoning
Province, China. Make some general observations about the morphology (physical
structure) of the fossil, and then record your observations on the lab worksheet.
*Form an initial hypothesis as to where you believe the fossil specimen should be
placed on the cladogram based on the morphological observations you made earlier.
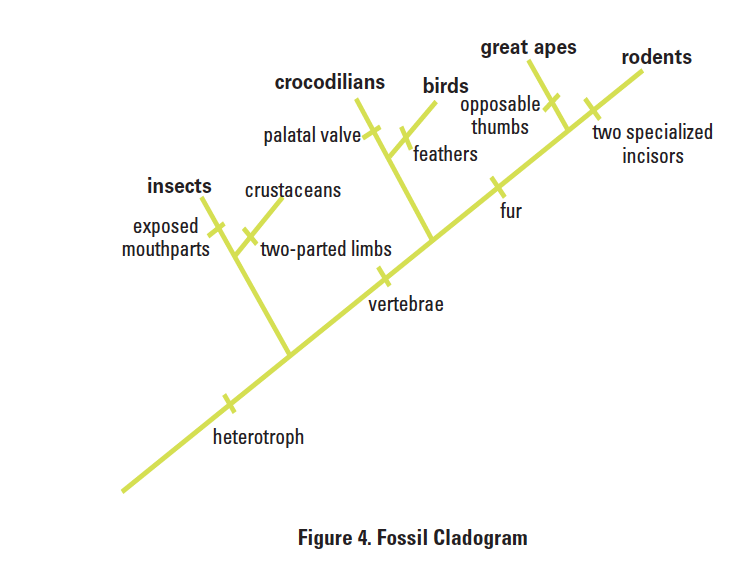
Draw your hypothesis on Figure 4 on your worksheet
Little is known about the fossil. It appears to be a new species. Upon careful examination
of the fossil, small amounts of soft tissue have been discovered. Normally, soft tissue
does not survive fossilization; however, rare situations of such preservation do occur.
Scientists were able to extract DNA nucleotides from the tissue and use the information
to sequence several genes. Your task is to use BLAST to analyze these genes and
determine the most likely placement of the fossil species on Figure 4.
A team of scientists has uncovered the fossil specimen above near Liaoning
Province, China. Make some general observations about the morphology (physical
structure) of the fossil, and then record your observations on the lab worksheet.
*Form an initial hypothesis as to where you believe the fossil specimen should be
placed on the cladogram based on the morphological observations you made earlier.
Draw your hypothesis on Figure 4 on your worksheet
Little is known about the fossil. It appears to be a new species. Upon careful examination
of the fossil, small amounts of soft tissue have been discovered. Normally, soft tissue
does not survive fossilization; however, rare situations of such preservation do occur.
Scientists were able to extract DNA nucleotides from the tissue and use the information
to sequence several genes. Your task is to use BLAST to analyze these genes and
determine the most likely placement of the fossil species on Figure 4.
|
Step 2
Locate and download gene files. Download three gene files from: Please NOTE the files will NOT open on your computer, you must download them to your computer (please make sure you save them to a location you can find easily later) |
|
Step 3
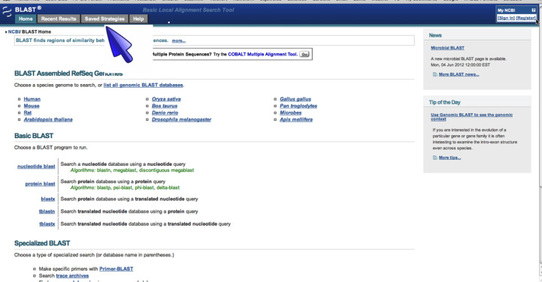
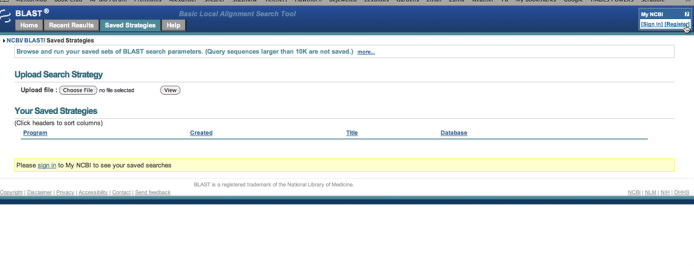
Upload the gene sequence into BLAST by doing the following: A) Go to the BLAST homepage: B) Click on "Saved Strategies" from the menu at the top of the page |
|
|
C) Under "Upload Search Strategy" click on "Browse" and locate one of the gene files you saved onto your computer
D) Click "View" |
|
|
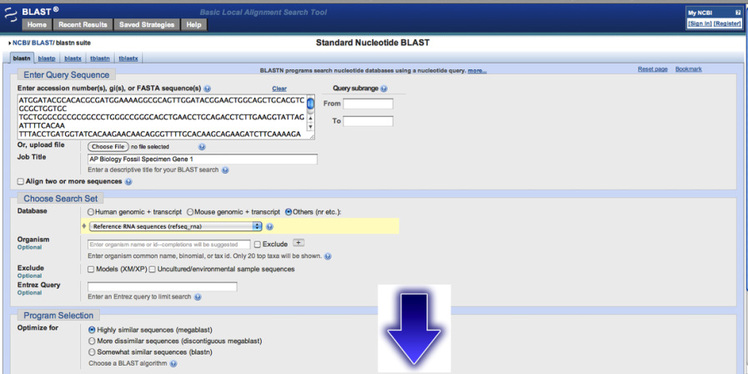
E) A screen will appear with the parameters for you query already configured.
NOTE: Do not alter any of the parameters. Scroll down the page and click on the "BLAST" button at the bottom. |
|
|
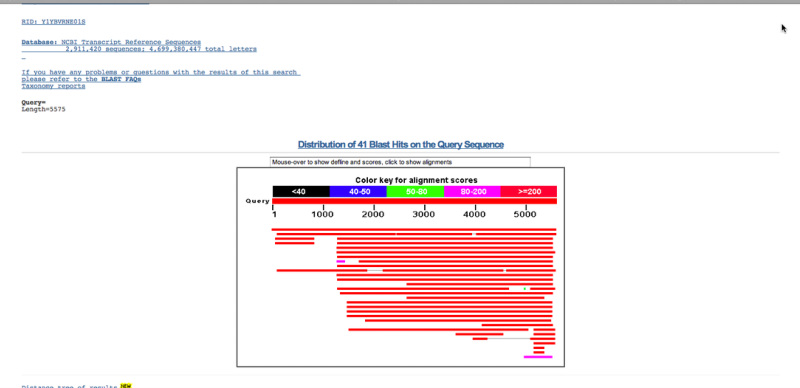
The results page has two sections. The first section is a graphical display of the matching sequences.
|
|
|
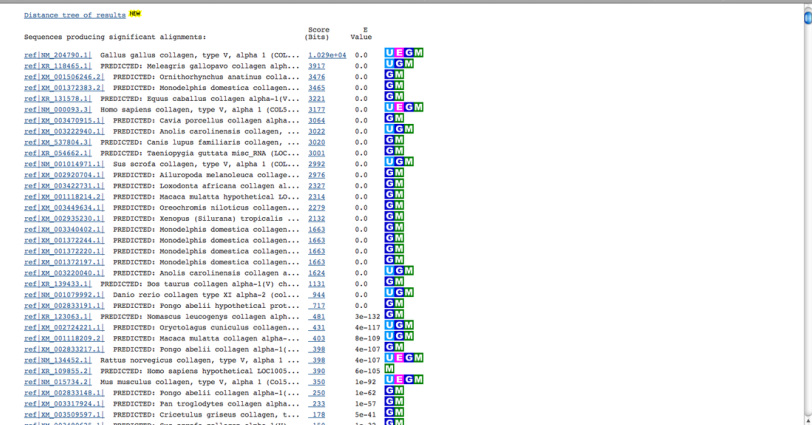
Scroll down to the section titled “Sequences producing significant alignments. The species in the list that appears below this section are those with sequences identical to
or most similar to the gene of interest. The most similar sequences are listed first, and as you move down the list, the sequences become less similar to your gene of interest. |
|
If you click on a particular species listed, you’ll get a full report that includes the
classification scheme of the species, the research journal in which the gene was first
reported, and the sequence of bases that appear to align with your gene of interest.
If you click on the link titled “Distance tree of results,” you will see a cladogram with
the species with similar sequences to your gene of interest placed on the cladogram
according to how closely their matched gene aligns with your gene of interest.
Analyzing Results
Recall that species with common ancestry will share similar genes. The more similar
genes two species have in common, the more recent their common ancestor and the
closer the two species will be located on a cladogram.
As you collect information from BLAST for each of the gene files, you should be
thinking about your original hypothesis and whether the data support or cause you to
reject your original placement of the fossil species on the cladogram.
For each BLAST query, consider the following:
• The higher the score, the closer the alignment.
• The lower the e value, the closer the alignment.
• Sequences with e values less than 1e-04 (1 x 10⁻⁴) can be considered related with an
error rate of less than 0.01%.
